Seen a sudden drop in website traffic over the last year? Google’s Core Web Vitals update is the likely culprit.
Following the search engine’s update in summer 2021, many websites saw a dramatic drop in search traffic coming to their site. That’s traffic they’ve not seen since, leaving sweaty-palmed marketing managers scrabbling for ideas.
Sound familiar? Keep reading if this describes your experience, or if you want to protect your web traffic from being penalised by future Core Web Vitals (CWV) updates.
This article is based on one of our popular webinars. View the video and download the slides:
How Google's Core Web Vitals update changed the SEO game
When it comes to SEO, there are lots of things you can't control. You can't control Google. You can't control who comes to your website or what pages they go to.
But, you can control the architecture, the engineering and the speed of your website.
What are Core Web Vitals?
Core Web Vitals (CWVs) are Google's way of measuring what the search engine thinks is important about website performance, meaning speed and responsiveness. There are three elements:
- Largest Contentful Paint (LCP) - How long does it take for a page to load? Usually measured in seconds, or, if your site is exceptionally slow, tens of seconds.
- First Input delay (FID) - How long does it take before the website is responsive to a user click or an interaction? Usually measured in milliseconds.
- Cumulative Layout Shift (CLS) - How much does the site change as it is loading? Usually measured in seconds.
Google measures these elements in two ways. Lab data, where you input your web page into a piece of software or a testing tool (more on this later). And field data, which is based on real user actions on your site.
Google won’t have or use field data for every page, but will determine what it’s measuring based on volume of traffic. The higher the volume, the more likely there will be actual field data. And, Google may aggregate that data across the site. That aggregation can cause a lot of aggravation. Why? If you have a lot of visitors from people with poor connectivity, such as mobile phones with 3G connections or places in the world where fibre isn’t a thing yet, that traffic can skew the data. So, to Google, your site might appear slow, even if for other users it’s fine and lab data shows you have a high performance site.
Why do CWVs matter?
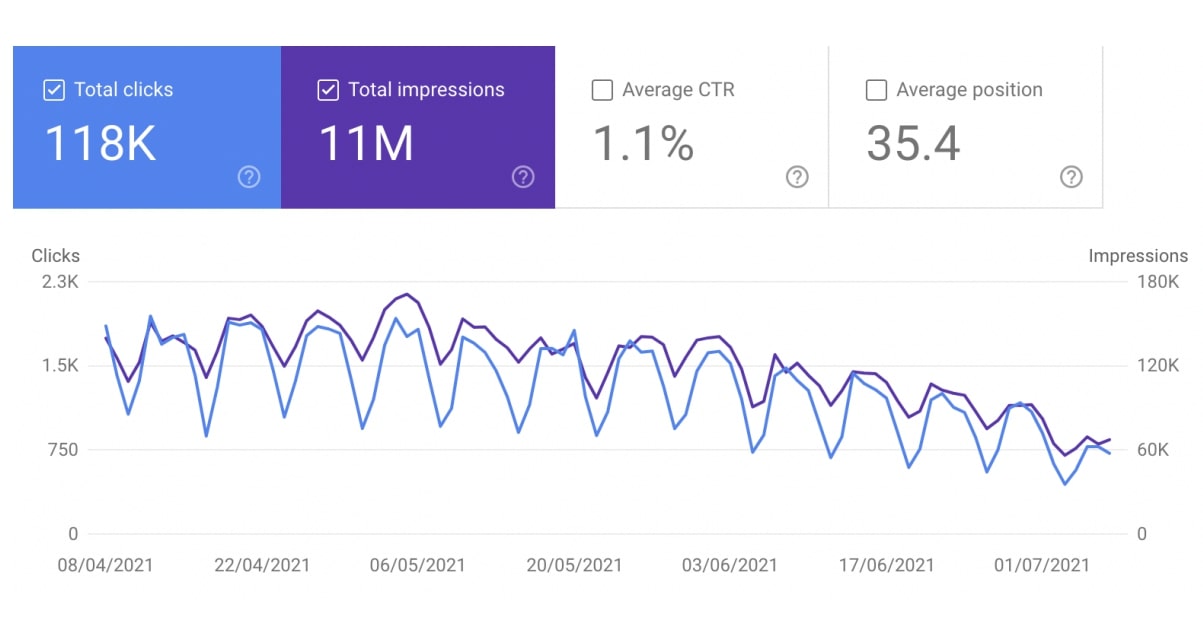
This is an example of a site that got hit by the CWV update and lost half its traffic in three months. Ouch. This data is coming from Google Search Console (more on that later).
Google penalises slow sites because users don’t like slow sites. What Google is trying to do with CWVs is to make the web more user-centric, which is a good thing. User experience matters when you’re selling things. Conversion rates drop for each additional second of load time up to five seconds and then they drop by 4.42 percent. In short, if your site is taking six seconds to load and your competitor's site is taking one second to load, they are going to see a better conversion rate than you.
The Core Web Vitals update has simply prioritised these factors when it comes to the SEO game. If you want to keep playing, you have to accept that the rules have changed. Then, adapt.
How to measure your site’s Core Web Vitals
Seeing the problem is the first step to solving the problem. Unfortunately, there is no one tool that is going to solve all your problems for measuring and optimising CWVs.
What you're trying to do is test if modifying something on your website has any impact on traffic, right? So you make a change, wait for real user data to accumulate over a month or two (lab data can only predict so much), and then wait for Google to notice.
You need to view the problem from different perspectives to get the full picture. That means multiple tools. After much trial and error, this is the toolkit we’d recommend:
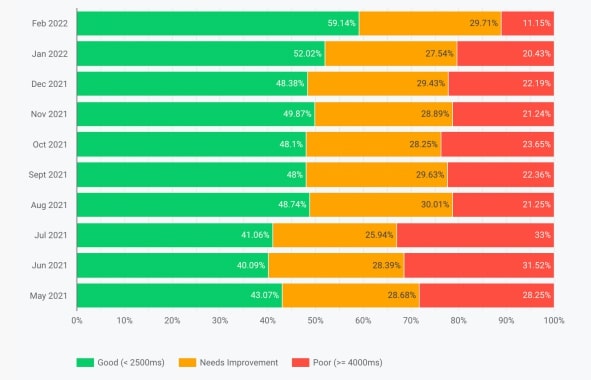
1. Google Search Console
Google Search Console is a free tool that you absolutely must use if you want real data on CWVs across your site as a whole. How many pages are scoring well? How many need improvement? How many are scoring poorly? Green, yellow, red. It’s the only place you can get Google’s own report on this level.
You can ask Google to formally review your site by clicking ‘Revalidate’ and Google will go and collect or review field data over several weeks. They say it takes up to 28 days.
Yep, you heard right. The data takes a month to refresh. That’s a very slow feedback loop.
2. Clickio
Clickio provides the closest thing to real-time data on Core Web Vitals that you can get. It requires you to put a tracker on your site, which ironically adds a bit of page weight, but it’s useful enough to be worth it as long as you act on the data you get out of it.
Clickio will give you feedback on changes over time. What is the Cumulative Layout Shift on all our website pages served to mobile devices in a particular country in the last month? What percentage of users are getting a Largest Contentful Paint of more than four seconds from our blog pages on desktop devices this quarter? You can slice and dice the data in a variety of ways to get the information you need.
Health warning: the tool shows Clickio’s interpretation of Google data. It is NOT showing you what Google sees. It’s the best leading indicator we’ve found for addressing potential CWVs issues without having to wait for months to get any feedback, and it provides a good amount of granularity, such as country-by-country data. But it isn’t actual Google data. And it being real-time data, you have to allow some time for enough meaningful data to accumulate before you can say with certainty whether a change you’ve made has worked or not. It’s not instant, but nor do you have to wait a whole month for it to refresh.
3. Google Analytics
Google Analytics will take some representative data points and will tell you page performance statistics on that basis, over time, so you can see where traffic drops off or picks up. If you don't have a lot of visitors, this data probably isn't going to be very useful to you, but it’s a good way to track this information over time and highlights slow pages that need your attention.
4. Google Data Studio
Google Data Studio shows a performance percentage across your site for each of the Core Web Vitals. Essentially, it’s a history of changes over time. Improvements, ideally.
This would be amazing if it was in real time. If you could look at the last 28 days on a rolling basis, job done, you’d just know that what you are doing is having an effect. Unfortunately, Google updates this monthly in arrears in the middle of the subsequent month. That’s an even slower feedback loop than Google Search Console. Therefore, it's a snapshot of retrospective data. Useful for monitoring progress, but slow.
5. Web.dev - Lighthouse
Web.dev, a Google owned site, provides an open-source tool called Lighthouse. This tool gives you lab data on individual pages. You input a URL and it will tell you performance accessibility, best practise, SEO score and so on - you can see more data if you click ‘View Treemap’ on the app.
There is some volatility in the data, in that the data might change a bit depending on your browser, the time of day, caching or other kinds of ‘internet weather.’ However, it’s still pretty good.
6. Web.dev - PageSpeed Insights
Google PageSpeed Insights is where you will get page-level field data. Again, you enter a URL and it will give you the field data for the LCP, CLS, FID, and so on. You need a certain volume of traffic to a page to get decent field data, however.
7. GTmetrix
GTmetrix deconstructs a web page and says how big each of the files are, how many things are being loaded, how it's architected and so on. This is a great tool for developers to QA pages and check they’ve not added a huge image file or a bloated widget that’s going to slow load times.
We suggest using this tool and the web.dev tools in conjunction to measure what changes have worked on a page-by-page basis.
8. DebugBear
DebugBear takes a list of pages and reports on Core Web Vitals and a few other metrics. It’s useful as a health monitoring tool rather than a diagnostic tool. You can use it to monitor 20 or so ‘canary in the coal mine’ pages. So if any activities add weight to your website then you can see it here.

How to optimise your website to improve Core Web Vitals
Now, let’s talk about what activities you can do to improve Core Web Vitals. You’ll get a lot of information from the tools above about where the problems are, so these are just some of the things we’ve done for ourselves and for clients, and that we know had an impact.
1. Rehost your website
This isn’t rebuilding or redesigning your site. It’s just moving it somewhere else. Typically, we see around 30 percent performance improvements for sites that we move from WordPress to HubSpot.
If you're sticking with WordPress, moving your site to a dedicated hosting company like WP Engine that actually knows about performance can make a really big difference.
By rehosting your site on HubSpot (or WP Engine), you’ll benefit from:
- Caching - this makes sites load faster after the first visit. A generic WordPress site will need a caching plugin, but HubSpot has it built in.
- Content deliver network (CDN) e.g. Akamai - this delivers files to the user from a local server, even if your website is hosted elsewhere.
- CloudFlare DNS - basically, this helps to speed up the domain name server side of things.
2. Switch off HubSpot’s social share code
If you are already on a HubSpot, the number one quickest win is to switch off HubSpot’s social share code on your blog. HubSpot leaves these buttons switched on by default, annoyingly. This will delete about 450 kilobytes of JavaScript code from every page on your blog.
Do a before and after snapshot of the page speed and loading time in GTmetrix and web.dev. It’s really satisfying.
3. Compress images
When you first launched your website, your developers may well have avoided using massive images. We hope. And we hope they used lazy loading for images, just as a general principle.
But later down the line, well-meaning marketers will add featured images to blogs and pages and suddenly. Bam. Your site is slowed down by a 40MB image file that could grace the side of a jumbo jet.
Compress images to <250KB, ideally <100KB. Convert images to jpg, or use svgs wherever possible. Be extra careful with logos, especially logos in the footer as these are on every page of your site.
Again, if you have HubSpot, Articulate made a tool called Fizz+Ginger to compress images on blog posts and website pages in HubSpot.
4. Avoid embeds
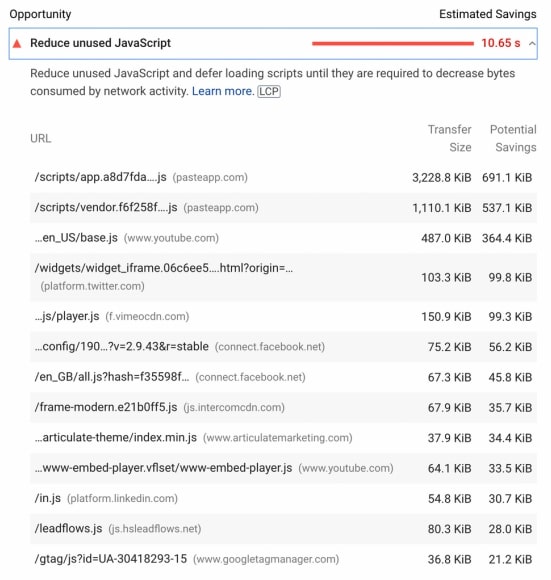
This is a screenshot from a page on our site that had an embedded presentation, an embedded YouTube video, a pop-up, images, and some live social media. All of that stuff added up to six megabytes of just… stuff. Stripping as much of that out as possible made that page load much faster. We replaced embedded videos with linked thumbnails, for example.
5. Simplify your marketing tools
Marketing tools add page weight. Things like Hot Jar or Lucky Orange that monitor page usage, or tracked calls to actions, or Google Tag Manager - having these tools on your site are useful, but they have a cost. The cost is performance. So you have to use them sparingly and judiciously.
6. Switch on AMP
There's a standard from Google called accelerated mobile pages, or AMP. With AMP, you get lightning fast load times. If a user clicks on a search result on a Google browser, it will serve them the AMP version of the page from Google servers.
But, in the process, you lose control over who serves that page and what it looks like. They strip it back to the bare minimum in terms of styling. It's a trade off.
7. Optimise your code
This is the long, hard slog of website optimisation. You can't just plug and play this. You need to optimise your code. For that, you must have a quality team of expert developers, who will implement things like:
- Minimising Javascript and CSS
- Delayed loading of Javascript
- Lazy loading by default
- Self-AMPification (e.g. not showing blog featured images on mobile)
- Good coding practices within the development pipeline
- Minimal use of plugins and external code
User experience is the website metric of the future
In the coming years, Core Web Vitals will only increase in significance. Businesses need to adapt their websites for performance and user experience now to avoid being penalised in the next big update.
Of course, we’d be happy to offer our SEO and website development services to help you get where you need to go. We’ve learned a lot about Core Web Vitals, and have embedded this knowledge into our processes, making our sites highly optimised and light-weight.
Contact us to get the site your users wish you had.


-1.jpg?width=400&height=250&name=birmingham-museums-trust-HEEvYhNzpEo-unsplash%20(1)-1.jpg)
.jpg?width=400&height=250&name=europeana-z_dGJqPPT0M-unsplash%20(1).jpg)

